Signals from Space! (part 2, and a Chronulator contest)
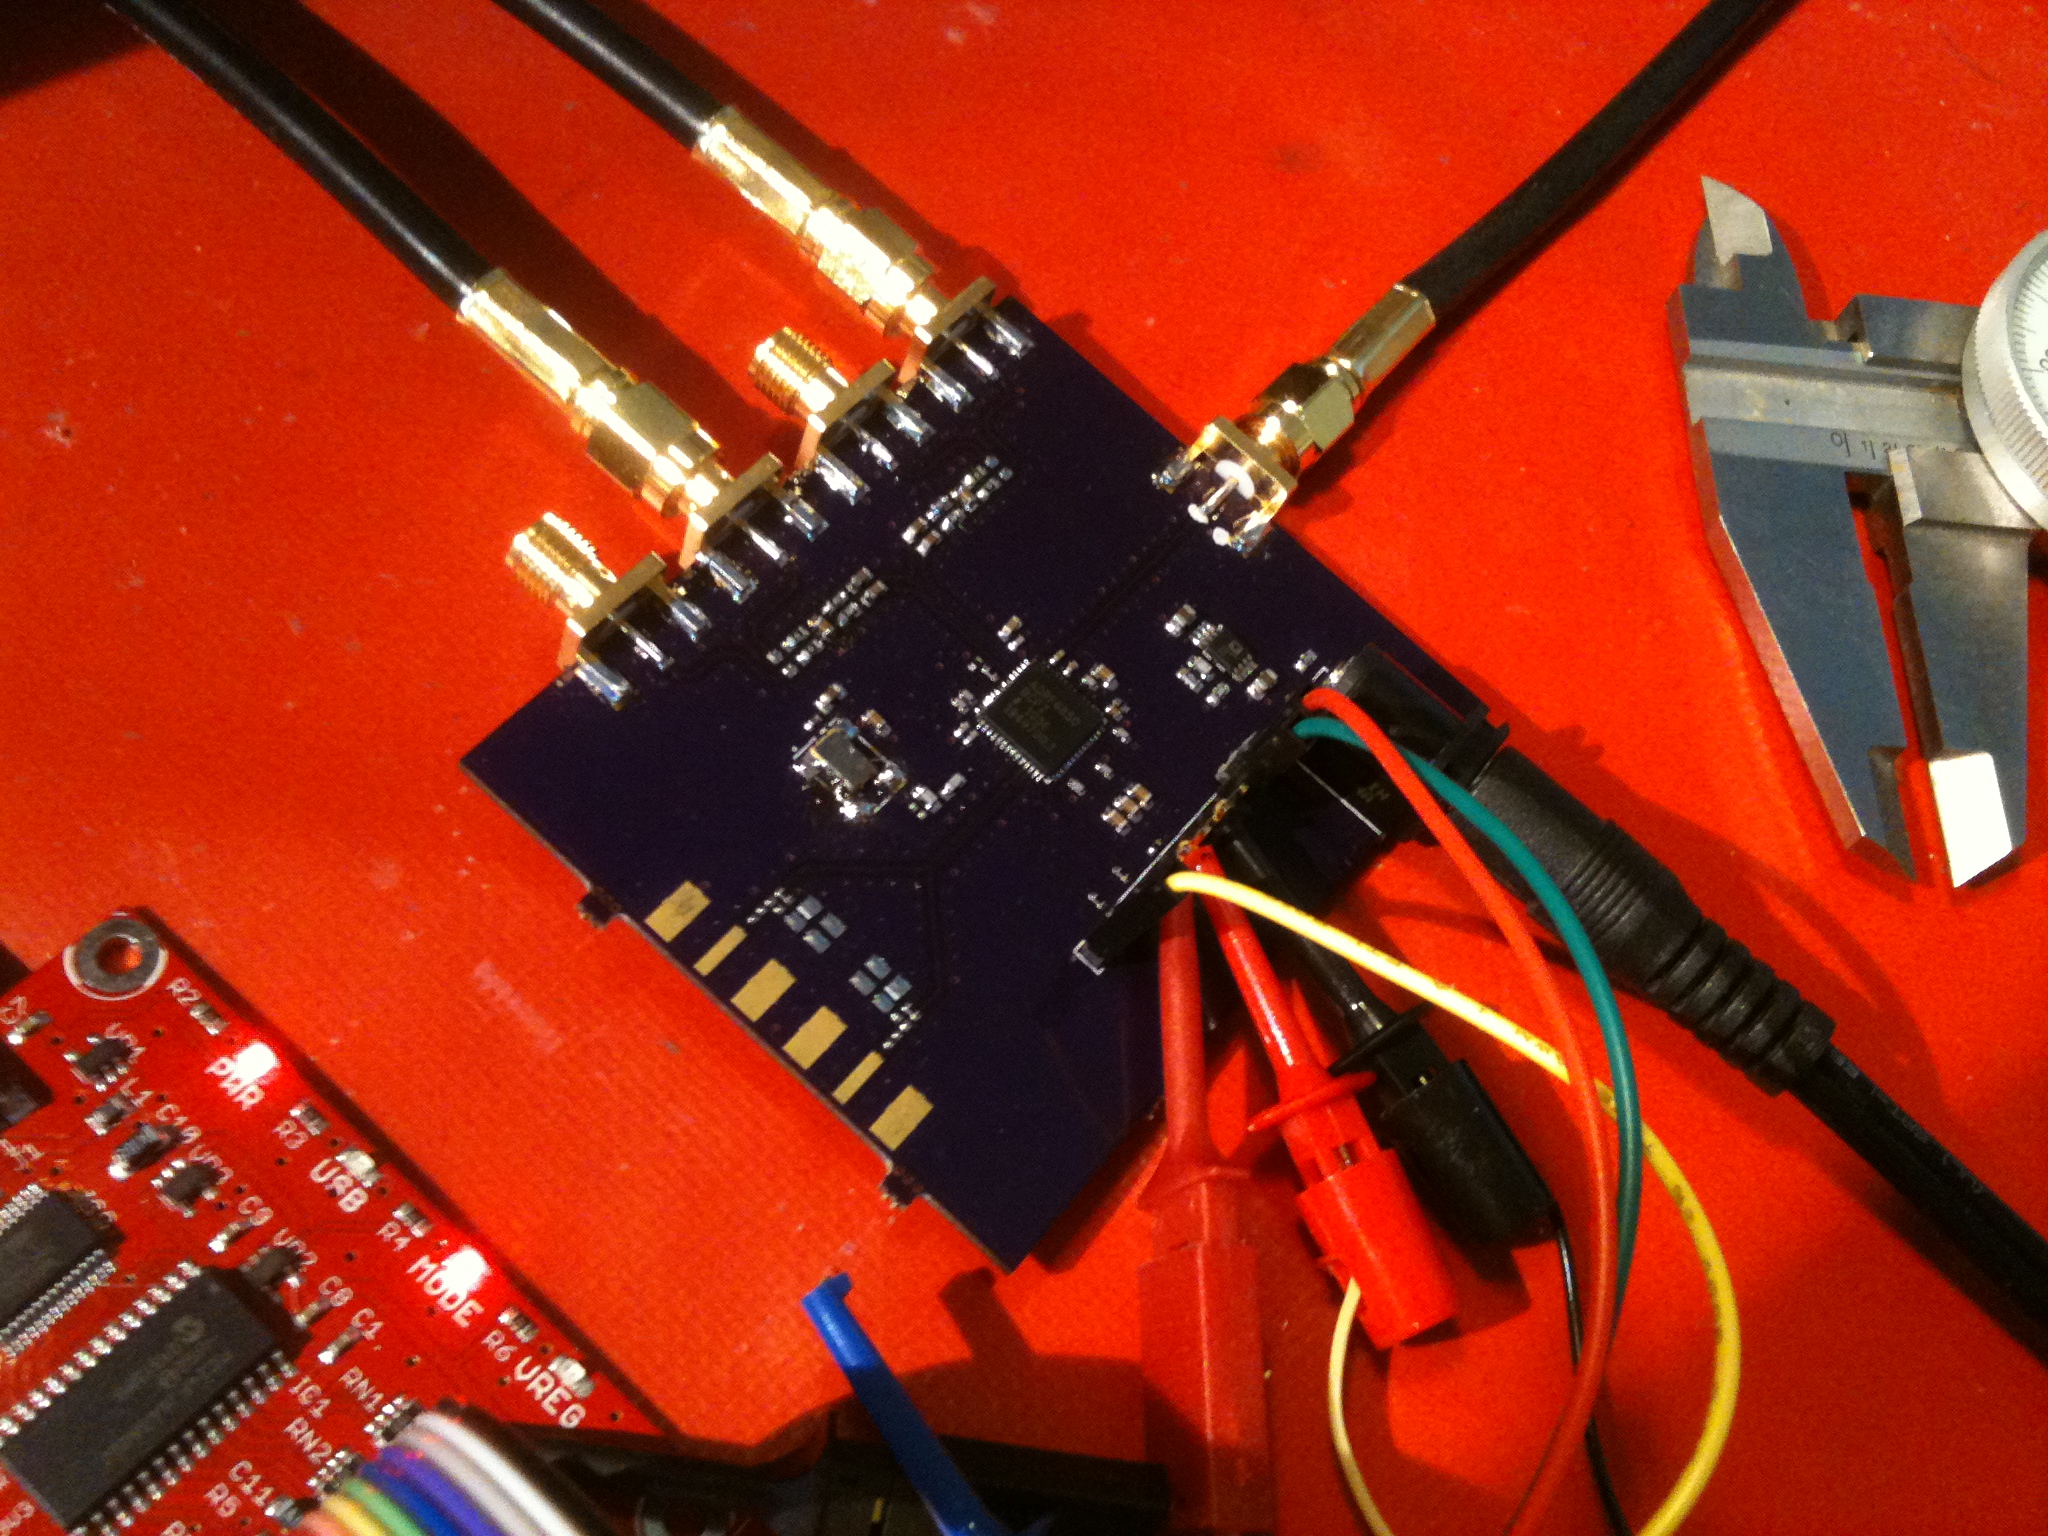
Quick recap: In part 1, I captured weather satellite signals with my software-defined radio prototype, using the audio input on my laptop. So, what can be done with these captured signals?
The first thing I did after recording the NOAA-19 APT signal was load it up in Audacity and examine the spectrum of the signal.
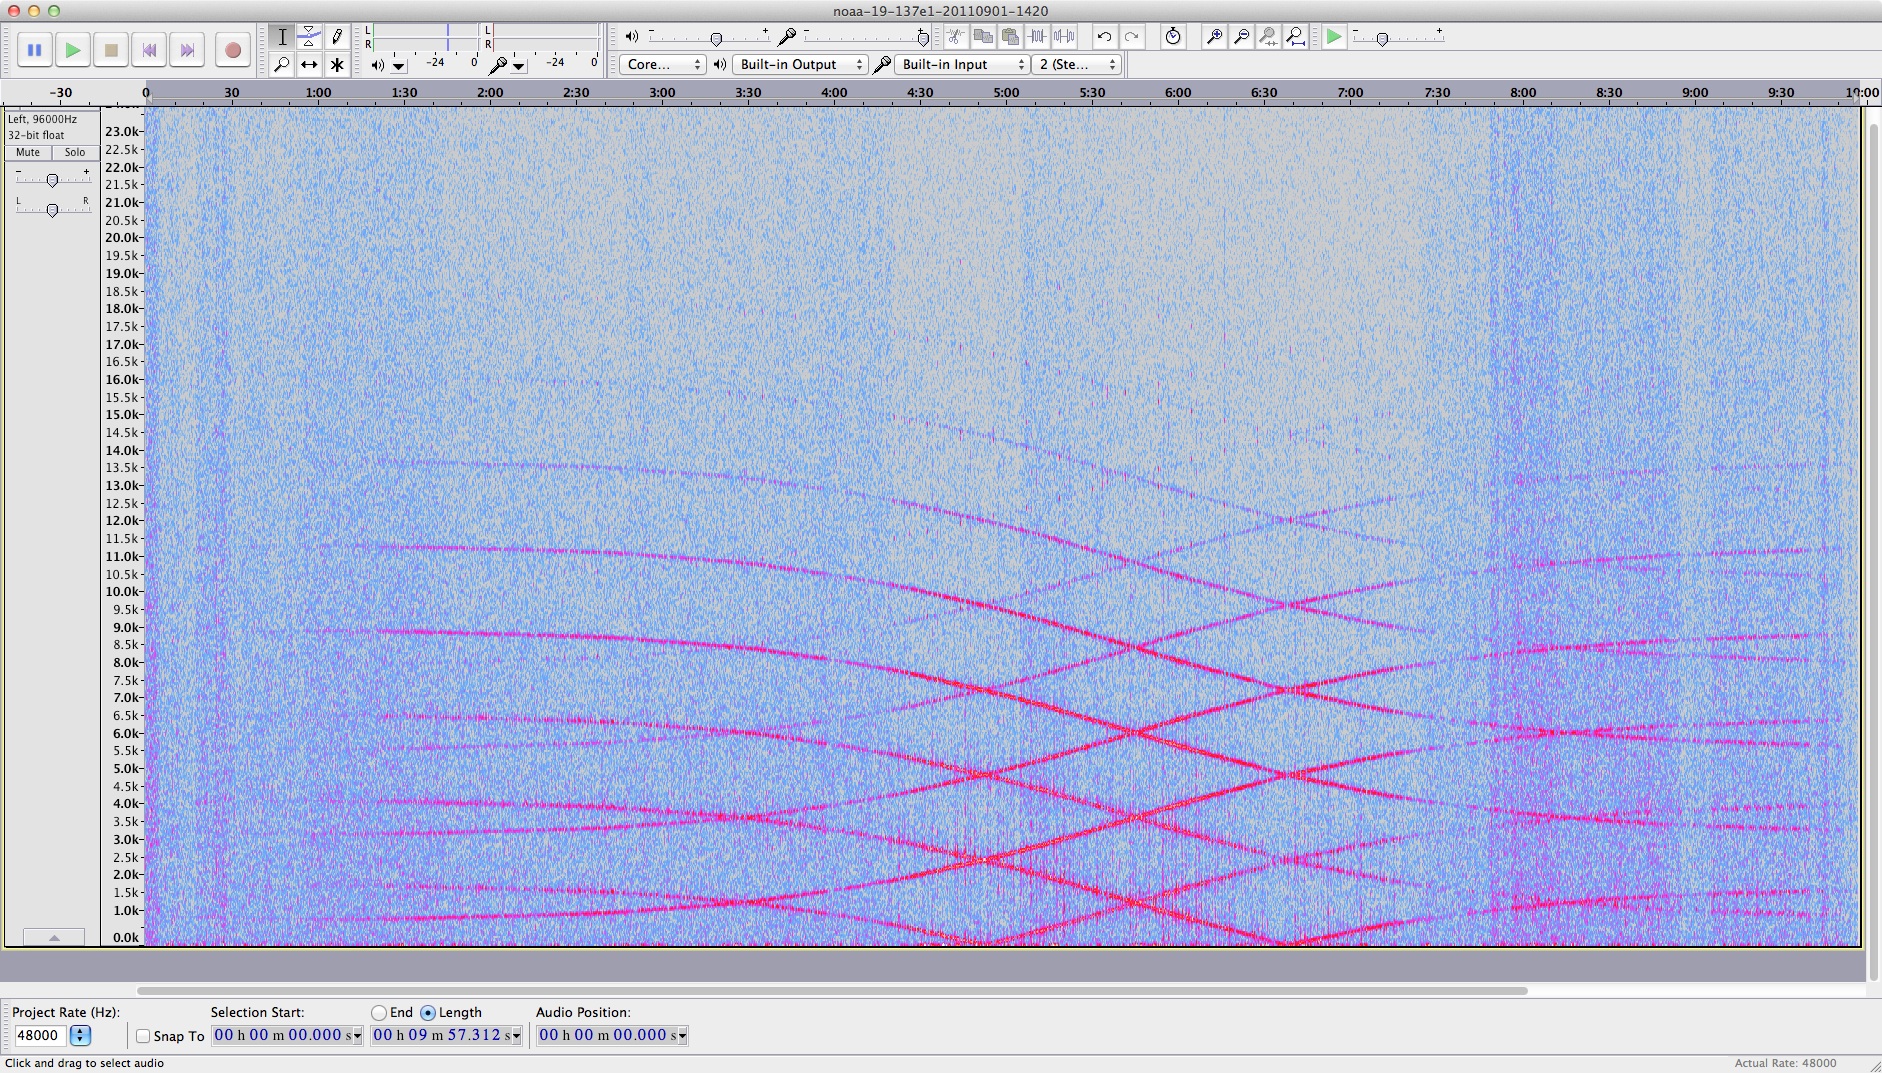
That's a cool looking pattern – and it's a bit suspicious too. The pinkish-purple curves indicate frequencies in the signal changing over time, over the ten minutes I recorded the signal. Notice how the frequencies change slowly at the beginning (left of the graph) when the satellite was rising over the horizon. The same thing happened at the end (right of the graph) when the satellite was descending back toward the horizon. When the satellite was directly overhead, the signal's frequency changed very quickly. Hmmm. (think think think…) Hey, that's the Doppler effect!
Indeed, the satellite is moving very fast – it orbits the Earth every 102 minutes. One Web site claims NOAA-19 is orbiting at 7.55 km/s, which is 27,180 km/h.
Let's say we don't already know how often the satellite orbits the Earth, or we don't know the distance the satellite travels in one orbit. If we measure the Doppler shift of the signal, we can calculate the satellite's speed ourselves. Here's my measurement of the frequency shift in the signal – I get 5.6kHz from the the start to end of the satellite's pass:
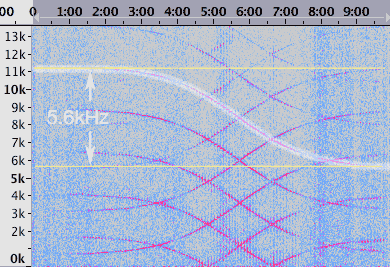
When the satellite is coming at me, the signal is "squeezed" and the frequency is increased by 2.8kHz – half of the 5.6kHz total shift I measured. As the satellite is traveling away from me, the signal is stretched and the frequency is decreased by 2.8kHz – the other half of the 5.6kHz shift. The frequency change as a percentage of the signal's original frequency (137.1MHz) is 0.00204% – pretty small. But consider that this percentage is the speed of the satellite as a percentage of the speed of the signal. The signal is traveling at the speed of light, which is roughly 1,079,000,000 kilometers per hour. If we take that percentage from the speed of light, we get… Drum roll… 1,079,000,000 km/h * 0.0000204 = 22,000 km/h.
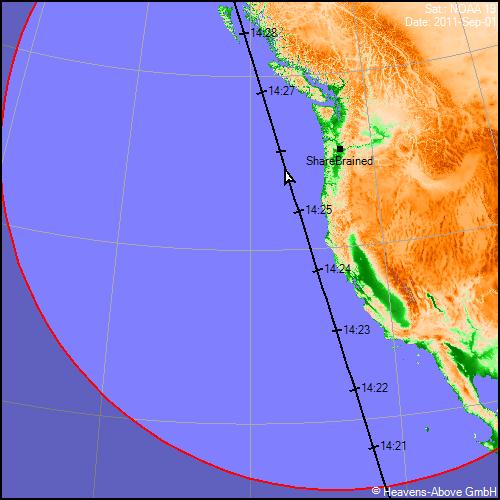
That's close, but no cigar. Why is that number 19% lower than the actual satellite speed over the Earth (27,180 km/h, from above)? That's pretty easy. The satellite is roughly 850 km above the Earth, and didn't go directly overhead, but perhaps 450 km to the west. Calculating the hypotenuse: sqrt(850850+450450) = 962 km is the closest the satellite came to me. If the satellite went right through me, the Doppler shift I measured would've given the right answer. (…and I'd be splattered all over.) But the speed that the satellite was traveling relative to me was less than the satellite's speed over the Earth.
Because I'm lazy and I've run out of room on my sketch-napkin, I'm offering a free Chronulator kit to the first person who can produce worked math that correctly compensates for the distance of the satellite from me, and gives an answer that's within a few percent of the actual satellite orbit speed. I'm sure there's a cosine or arctangent involved… Tweet your solution to @sharebrained or e-mail it to info@sharebrained.com – a camera-phone photo of a hand-written solution is fine (as long as I can read it!).
In part 3, I decode the signal to get at the weather images inside.
Comments
What you're seeing is the relativistic Doppler effect which is an effect of special relativity and shouldn't be named for Doppler in my opinion. At the speeds you're working with, however, the classical Doppler effect is a good approximation (within about a thousandth of a percent).
@mossmann: Thanks for the correction. I'm definitely not a physicist, but that won't stop me from trying. Somebody once said, "teaching is the practice of telling smaller and smaller lies." Is it really lying if I don't know any better? :-)
There's a lot lacking in my calculations – wave propagation velocity (in a vacuum, in the atmosphere, in different atmospheric conditions), precision of my radio's oscillator and that of the satellite's, rotation of the Earth relative to the satellite's orbit, etc. etc. etc. And then there's the utter lack of precision in my frequency measurement. It'd be generous to say that my measurement was accurate to 1%. So an approximation to 1/1000% will do in this case, if it makes the science more accessible to those who'd never thought of receiving satellite signals at home.
Relativistic effect is negligible at these speeds, but what actually matters is the angle between the satellite trajectory and the line directed to the satellite. Effective speed (for Doppler calculation) is the satellite speed times the cosine of this angle. This cosine in your case is ~0.8094 which corresponds to the angle of ~36 degrees. To calculate this angle you need to have an orbit height and the altitude of the receiver (to calculate horizon angle, if it's zero you can take it as 90 degrees). What we can do is to calculate orbit height back from known trajectory angle. It is Earth radius (Re) divided by cosine of trajectory angle (given the horizon is at 90). So you satellite must be 7848 km from the Earth center or 1496 km above the Earth. This is all considering satellite orbit passes through you. If it is aside from you it becomes more complicated. I'll send you the sketch separately.
Yeah, my first thought when I read your post was "how much of the discrepancy is due to relativistic effects?" It turned out to be not enough to matter. I think you're right that the lion's share can be accounted for in the distance of closest approach.
My calculation assumed it is passing directly through you, so my calculated altitude of 1496km is far from actual 858km. We need to know the angular distance between satellite orbit and you to improve the calculation.
@mossmann: Oh how I wish for a spacecraft that travels fast enough for relativistic effects to be significant…
@Victor: I got your solution sketch by e-mail. I was hoping for a solution that was not dependent on the satellite speed I looked up on the Internet.
If it helps, here's what we know.
Time:
Locations:
Distances:
Frequencies and Speeds:
I'm beginning to realize that computing the maximum frequency deviation is tricky. Is there a reasonable approximation we can make based on the distance of the satellite at the horizon? I'd be happy to measure and estimate a couple of bits of data if it keeps the math fairly simple.
Instead of using the total frequency deviation, how about measuring the maximum rate of change of frequency?
@mossmann: I'm not sure. As a thought experiment, I imagined the satellite going right through my antenna, so that the rate of change would be infinite at the moment it was at my antenna. The deviation on either side of the antenna would be proportional to the satellite's speed. But the rate of change, in that instance, would not vary based on speed. In the real-world example of a satellite 1000 km away, the rate of change would be the same for a satellite traveling twice as fast, but some additional distance away.
It seems like there's a bit of trig or integral calculus that would account for it. Draw a line between me and the satellite, at the point the satellite was nearest to me. Then observe the rate of change of that angle at the instant the satellite is closest. That's also the point of maximum frequency change over time. And that change in angle, when put in proportion to the distance between me and the satellite, should also express the speed of the satellite relative to me. (At this moment, I am reminded that I've forgotten more calculus than I learned.)
In any case, Victor's convinced me that computing the satellite's actual speed over the Earth is far from trivial. I hold out hope some rocket scientist (or Victor, who seems to at least resemble a rocket scientist) will drop in to this thread and get a useful number from what I've provided. However, I should probably let this challenge go for now… I have other maths to beat my head against – like how to design a CIC filter!
No, I am unfortunately not a rocket scientist, but physicist by education anyway. I am a professional programmer now and electronics amateur.
So far I can not devise any other significant factors - we need something around 1.5 multiple to explain why calculated orbit is 1400 km instead of actual 890 km.
I am still thinking of it in the background and discussed with colleagues (without conclusion, though).
I think we overlook something obvious for actual rocket science, but not easily derivable from the first principles.
I'll try to compensate for Earth rotation, for this I need an angle between satellite trajectory and Earth movement (orbital inclination, 98.83 according to Wolfram Alpha).
It's 2am here now, I will conclude my calculation later.
Is the recording in FM or AM? I'm also trying to observe the Doppler shift from transmissions from such satellites
@ianyappy: I'm pretty sure the audio in the video is the raw, FM-modulated signal from the satellite. I received the signal using a quadrature receiver, so I was capturing raw I and Q samples. When considered as a complex-number vector, the I/Q samples deliver a range of spectrum centered around the carrier I was tuned to. That spectrum would still contain the FM-modulated signal as transmitted from the satellite and the frequency shift due to the relative motion of the satellite. That shift is definitely audible in the video I posted, so that's why I figure it's the raw received spectrum. I hope that helps!
Thanks for the reply, I'm learning about such satellite stuff and I have been looking at another communications system, Orbcomm. There is some software, Orbcomm Plotter, that took in the NFM demodulated audio to obtain the telemetry data that they pipe down. I was hoping to observe this Doppler shift from the recorded audio but upon further reading, I think it's quite impossible to observe the frequency shift in either AM or FM demodulated output. So I was quite surprised when I saw the Doppler profile in your audio but since you said it's I/Q raw, I believe I understand.
On a side note, do you know what is the bunch of frequencies that seem to increase with time (i.e. tail up)? I believe the Doppler profile should always show frequencies tailing down, since.. they usually come toward you and then go away. Is this some recording artifact?
@ianyappy: There may have been significant I/Q magnitude or phase imbalance in my captured samples, or an error in my processing of the complex spectrum. I wouldn't be surprised if there was some frequency folding around 0 Hz (DC), or some aliases between positive and negative frequencies. That would account for the upward-trending frequencies.